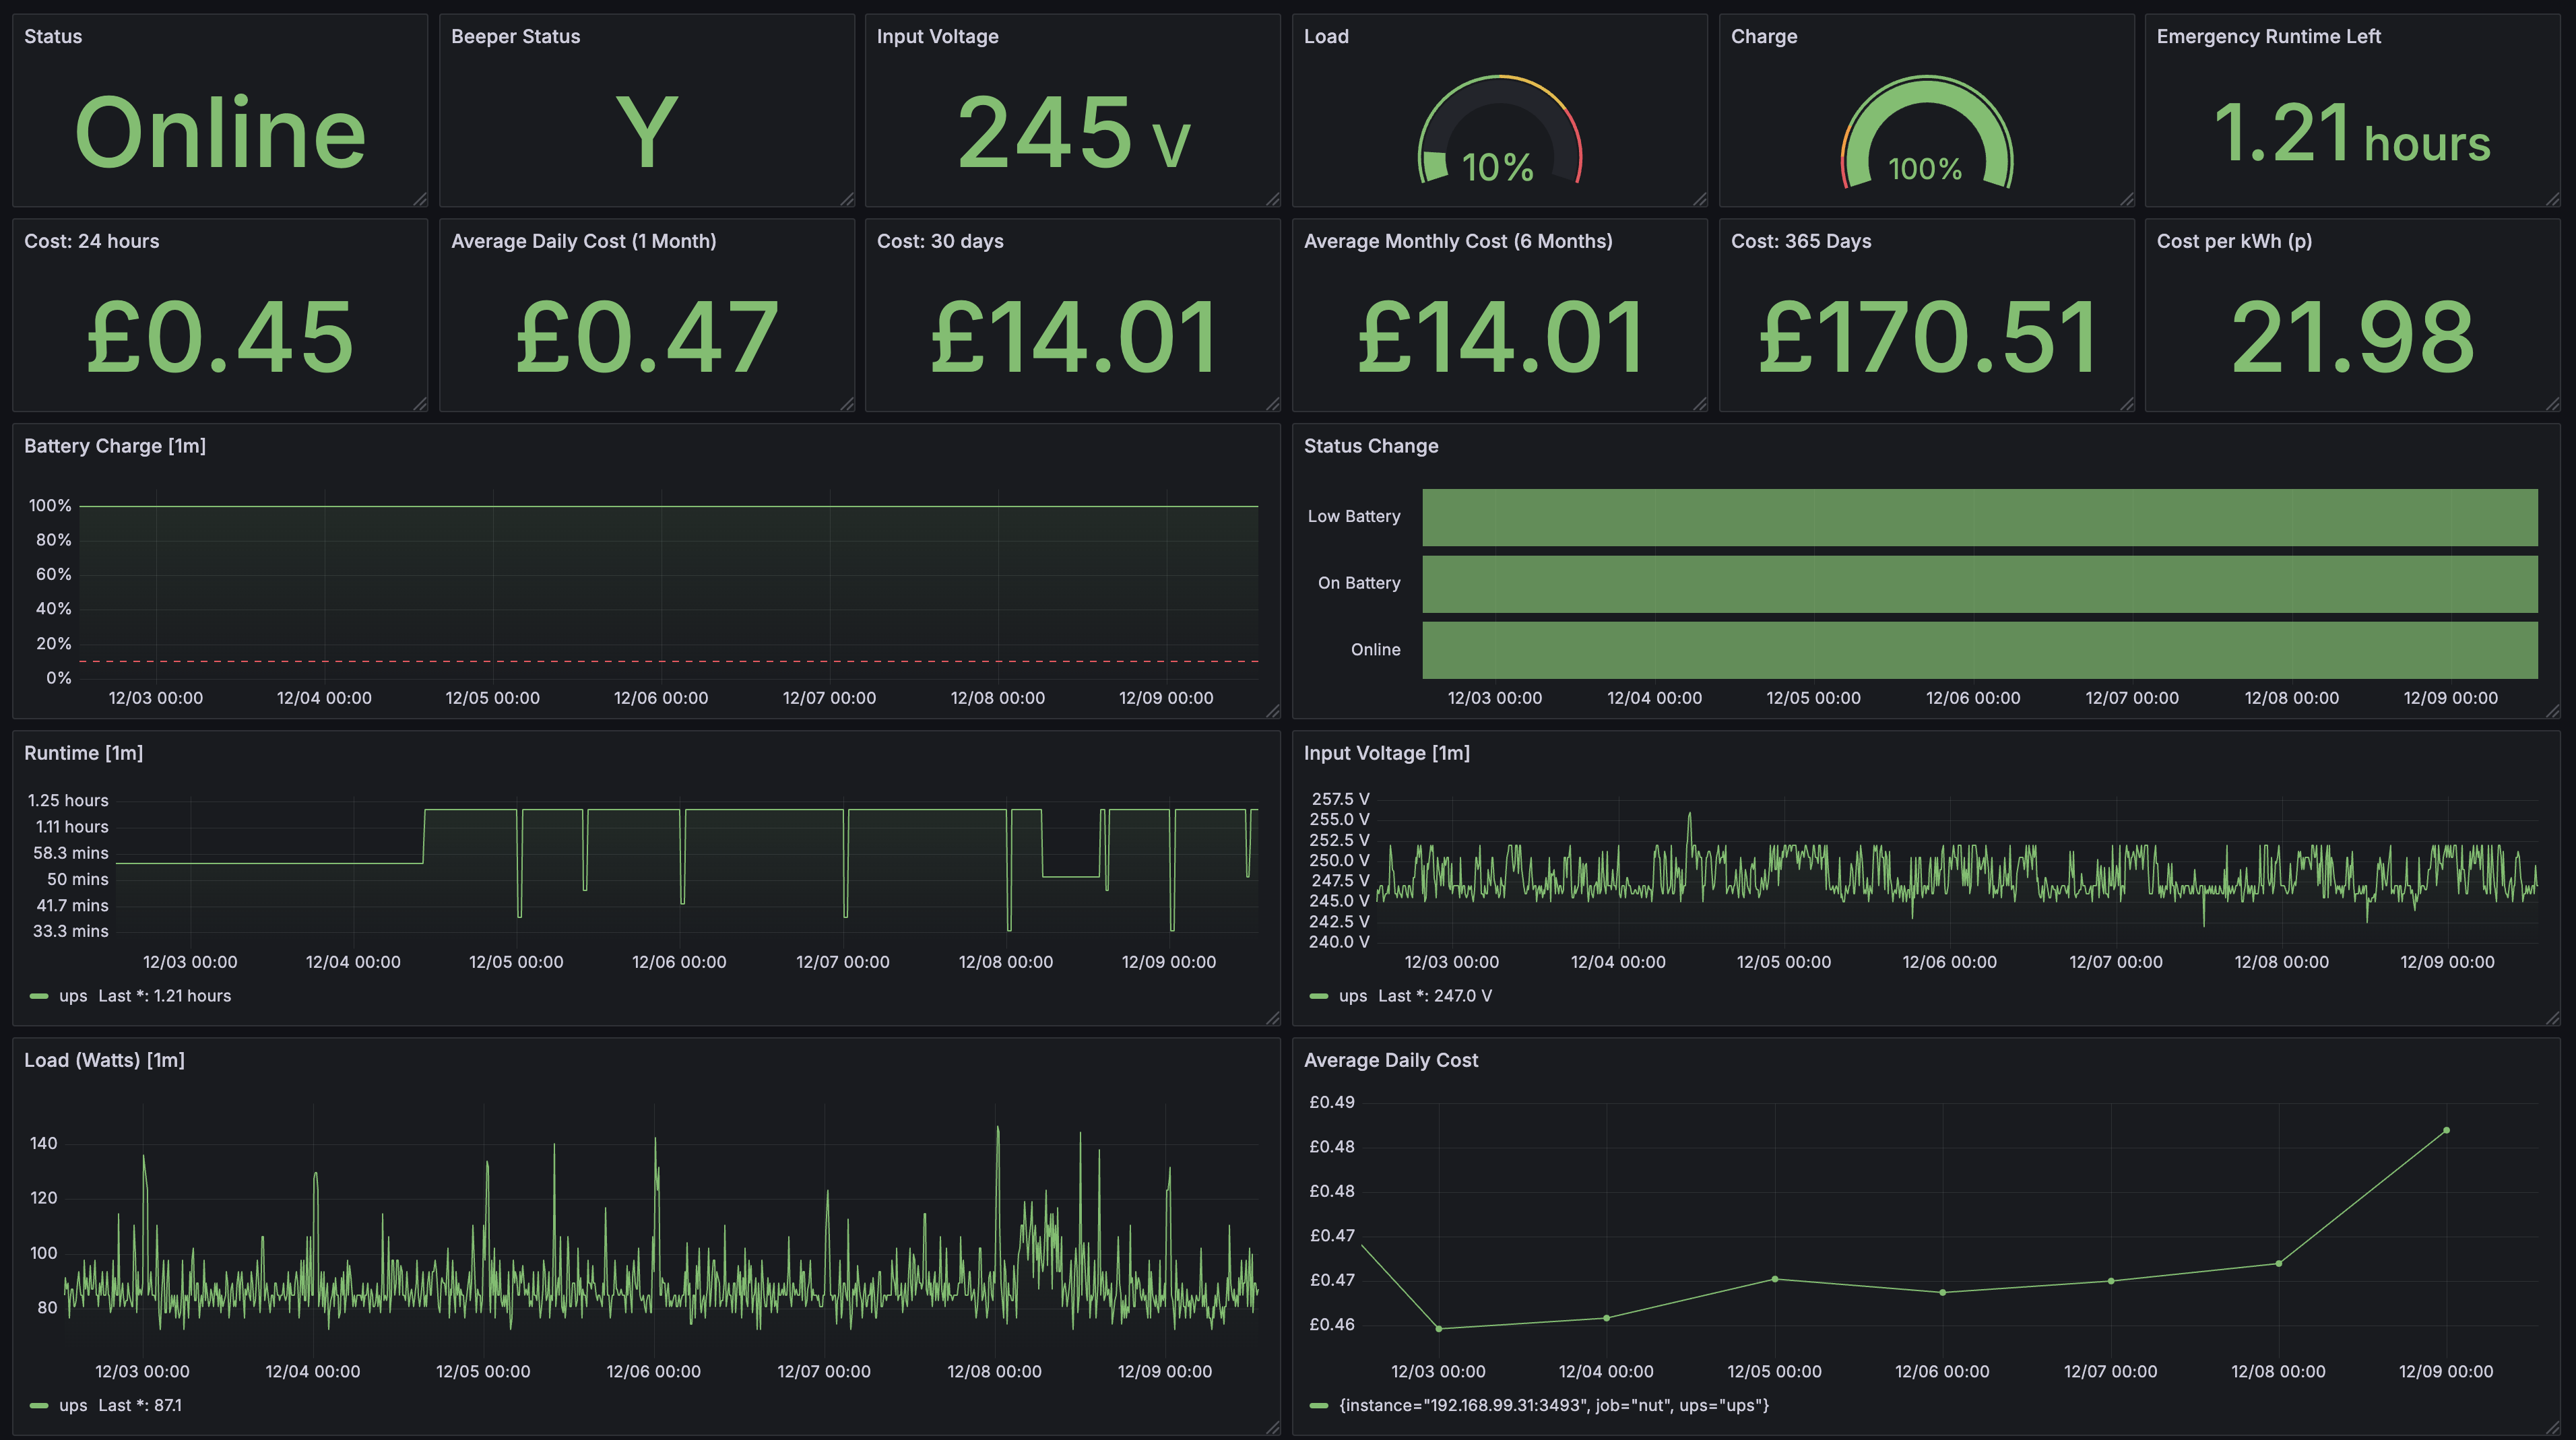
Check out the Grafana Dashboard here
Today, I wanted to share a recent adventure in my self-hosted journey—setting up a UPS (Uninterruptible Power Supply) to support my homeserver in case of emergency.
Adding a backup battery for reliable power in the event of a power cut is a good idea if you want to ensure your applications stay up 24/7. Another interesting benefit it gives is the ability to collect metrics on things like input voltage and server load over time.
Like many others with a passion for self-hosting I rely on the services I run at home more and more. It’s reassuring to know I have at least an hour of battery available, to either weather the storm until the power returns or gracefully shut down the server otherwise.
Choosing the Right UPS
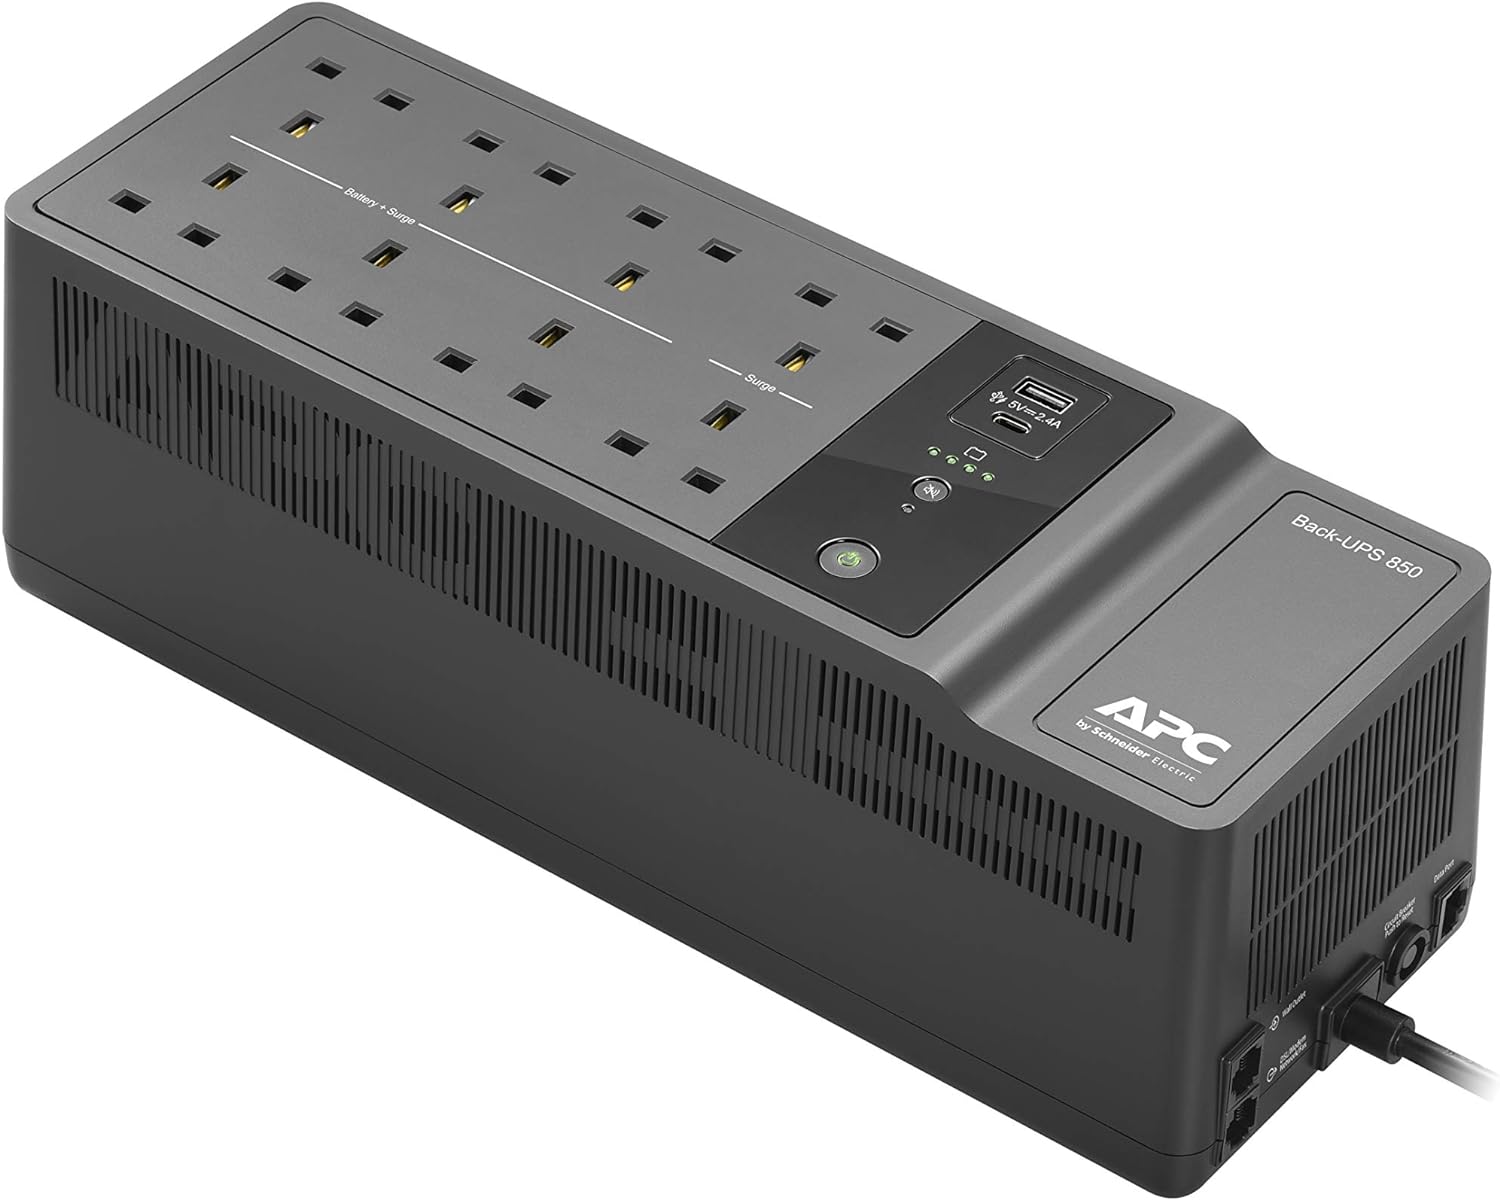
After some research and consideration of cost and the estimated power consumption of my home lab devices (~80 watts), I decided to go with the APC UPS BE850G2. This model provides a good balance between cost and functionality, giving me peace of mind without breaking the bank.

Installation Experience
Setting up the UPS was surprisingly straightforward. The tricky part was accounting for the brief downtime while I plugged everything into the UPS. Otherwise, it was very much a plug-and-play experience. The battery charges fully in about an hour, and with my setup, it should provide around an hour of emergency running time if the power goes out. Plus, it can automatically shut down my server just before the battery runs out, which is a huge plus.
Monitoring Power Consumption and Stability
One very interesting aspect of having a UPS is the ability to monitor power consumption over time and calculate the cost. It also exposes metrics about the stability of the power coming from the grid. At the heart of this monitoring is the NUT (Network UPS Tools) server, which communicates with your UPS and exposes metrics and controls.
Setting Up NUT
I have TrueNAS installed, which conveniently comes with a NUT server built-in. Following the documentation, I turned on the ‘UPS’ service in TrueNAS (aka the NUT server) and configured it. It was a breeze.
Integrating with Grafana
Next, I was keen to monitor all the metrics NUT exposes in Grafana. This meant I needed an exporter service to push the metrics into Prometheus. A quick Google search led me to this handy tool: prometheus-nut-exporter . The instructions for getting it up and running with Docker compose were straightforward, and adding the configuration to Prometheus was a piece of cake.
Building the Grafana Dashboard
With everything set up, my focus turned to finding a Grafana dashboard to visualize the data. I first used the dashboard inluded in the repo above, which looked promising. It mostly worked out of the box, which was fantastic. I just had to tweak the status label chart to match the labels my specific UPS was producing. I did this by looking directly at the metrics URL exposed by NUT.
After some moving charts around and deleting the ones I didn’t need, I got the dashboard to a place where I was happy with it. I really wanted to see the cost over time, so I added some more charts and calculations to see the cost averaged per day, month, and year. This is achieved by entering your cost per kWh at the top of the dashboard.
Check out my dashboard here on GitHub.

Final Thoughts
So there you have it! Adding a UPS to my home server setup was another step in the self-hosted hobby ladder. It’s amazing how a relatively simple piece of equipment can open up a world of monitoring and insight into your power consumption and stability. Plus, it adds a layer of protection to your setup that is invaluable.
I think it’s pretty cool and interesting—if not a bit over the top..
Happy self-hosting!